Why Scheduling?
Why do we need to know how to schedule the activities in a project? Even more important - why do we need to know how to do it by hand??? The answer on both questions are quite simple: Firstly we need to know how to schedule the activities in a project to know what must happen when and in which order to ensure that we complete the project in time. Secondly we need to know how to do it by hand in order to understand what a network diagram is and how it can support us in managing the project.
I know you most probably use a software scheduling tool to do the scheduling for you, but if you do not understand the principles of scheduling how will you ever know if the answer you get from the software package is representative of how you envisage the project to be done? Remember the software scheduling package will do all the calculations based on the information provided by you - therefore you need to understand what information the package needs and what it is going to do with it. Another important aspect to keep in mind is that the software package will use defaults or tables set up by you, the PMO or somebody else and therefore the resulting schedule presented by the software is not necessarily always a true reflection of how you visualized the project. Understanding how scheduling is done will help you to identify if the schedule presented by the software is realistic and a true representation of the project schedule to be implemented.
Please bear in mind that this discussion is based on the activity-on-node method (AON) as normally used in the Critical Path Method (CPM). Also please note that this is a discussion of the basic principles of project scheduling and will therefore not address the more complicated scheduling scenarios.
The Basics of scheduling
Before we look at what scheduling is all about there are a few rules that we should keep in mind. Adherence to these rules can save you a lot of sweat and tears, whether you do the scheduling by hand or using a software scheduling tool. A network diagram should have:
See the figure 1a below for an example of how the network should look:
- One and only one start activity.
- One and only one end activity.
- All activities except the first one should have at least on predecessor. (Predecessor:- a task whose start or finish date determines the start or finish date of its successor task.)
- All activities except the last one should have at least one successor. (Successor:- a task whose start or finish date is driven by its predecessor task.)
See the figure 1a below for an example of how the network should look:
 Figure 1a: How a network diagram should look |
|
When plotting a network diagram by hand it is also good practice to ensure that:
- All links (dependencies or relationships) are indicated by an arrow. Not just a line - an arrow with a arrow head indicating which activity is dependent on which.
- All links start or end either at the front or the end of the activity - never somewhere in the middle.
- The network flows from left to right - not making a 90 degree turn and then flows either up or down.
- Early start and finish dates calculated from the forward pass are displayed above or at the top of the activities.
- Late start and finish dates calculated from the backward pass are displayed at the bottom or below the activities.
| 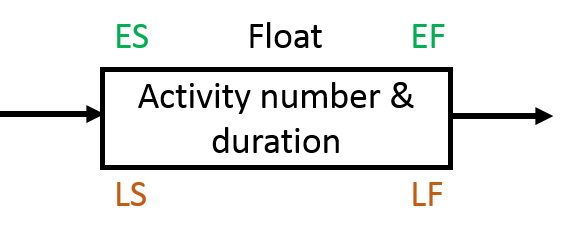 Figure 1b: Information layout |
The building blocks of a network diagram
A network diagram (or "project schedule network diagram" as per the PMBOK® Guide) consists of boxes representing the activities (or tasks) linked together with arrows representing the logical relationship (dependency) that exists between the activities. The logical relationships can include:
Finish-to-Start (FS)
The finish-to-start dependency is the most commonly used relationship in network diagramming.
A finish-to-start relationship is used when the predecessor activity or activities (Activities C, D and E) can not start unless the predecessor activity (Activity A) is completed.
A finish-to-start relationship is used when the predecessor activity or activities (Activities C, D and E) can not start unless the predecessor activity (Activity A) is completed.
| For instance if activity A is obtaining of approval to erect a new building, then activity C (clearing the site), activity D (obtaining the building material) and activity E (obtaining the builders) can commence once the approval has been obtained. |  Figure 2: Finish-to-Start relationship |
Bear in mind that the FS relationship does not specify that Activities C, D and E must start once activity A is completed - it means they can start if there are no other constraints delaying the start of these activities.
Examples where the successor(s) cannot start until the predecessor(s) have been completed (FS relationship) include:
Examples where the successor(s) cannot start until the predecessor(s) have been completed (FS relationship) include:
- The final testing (successor) cannot be done until the product is completed (predecessor).
- The new policy may not be implemented (successor) until it has been approved by management (predecessor).
- The walls of the building may not be erected on the slab (successor) until the strength of the foundation slab has been verified (predecessor).
Start-to-Start (SS)
In a Start-to-Start relationship the successor(s) cannot start until the predecessor(s) have started for instance:
- Project management (successor) can not start on the project until the project go-ahead (predecessor) is obtained.
- Observing the work process (successor) can not start until the worker starts executing the work process (predecessor).
| 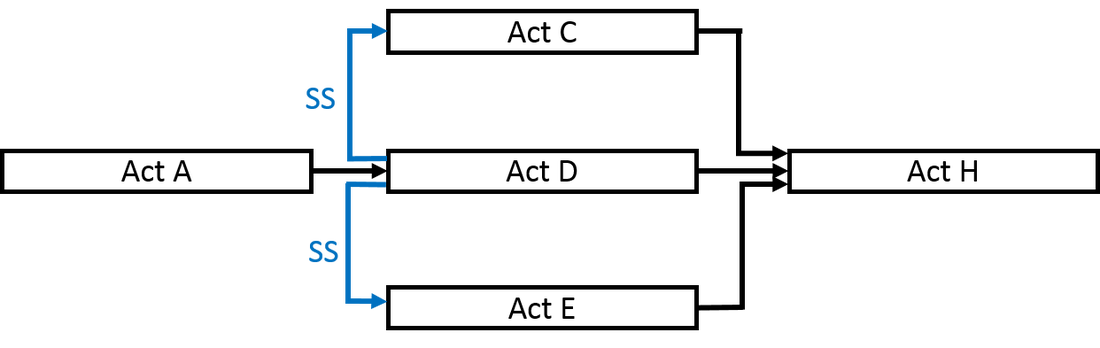 Figure 3: Start-to-Start relationship |
In the example in figure 3 there is a SS relationship from activity D to activity C as well as from activity D to activity E. This means that activity C cannot start unless activity D has started and likewise that activity E cannot start unless activity D has started. Please note that there is no relationship between activity A and activities C and E. The completion of A does not directly trigger the start of C and E as the start of C and E is dependent on the start of D.
Finish-to-Finish (FF)
A Finish-to-Finish relationship means that the successor(s) cannot finish until the predecessor(s) have finished for instance:
- Project management (successor) can not finish on the project until the final sign-off for the project (predecessor) has been obtained.
| 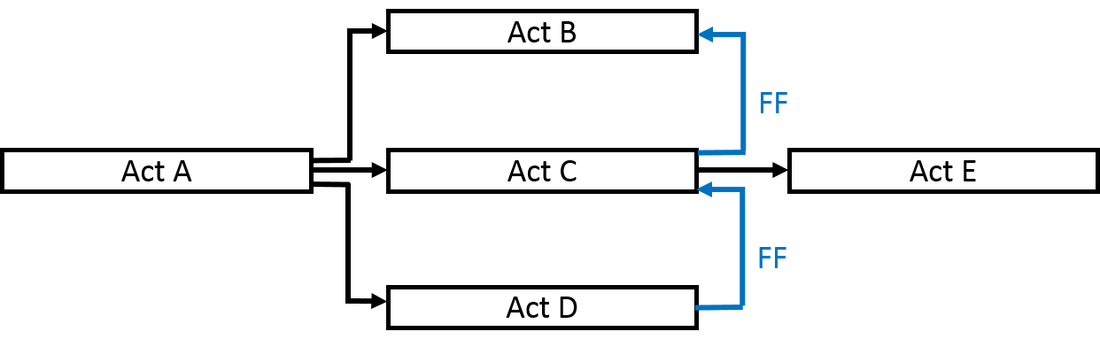 Figure 4: Finish-to-Finish relationship |
In the example on figure 4 activity B can not stop until activity C is completed and activity C can not stop before activity D is completed - it is important to note the direction of the arrow. Bear in mind that there is no direct relationship between activity E and activities B and D, the relationship is between E and C.
Start-to-Finish (SF)
The start-to-finish relationship is the least used relationship in project scheduling. In this type of relationship the successor(s) cannot finish until the predecessor(s) have started for instance:
|  Figure 5: Start-to-Finish relationship |
From the example network diagram in Figure 5 it can be seen that activity E (successor) can not stop before Activity F (predecessor) has started. Please note the definitions of a predecessor and successor. Predecessor:- a task whose start or finish date determines the start or finish date of its successor task. Successor:- a task whose start or finish date is driven by its predecessor task.
Lead
Lead is the amount of time (i.e. number of days) whereby a successor activity can be advanced with respect to a predecessor activity.
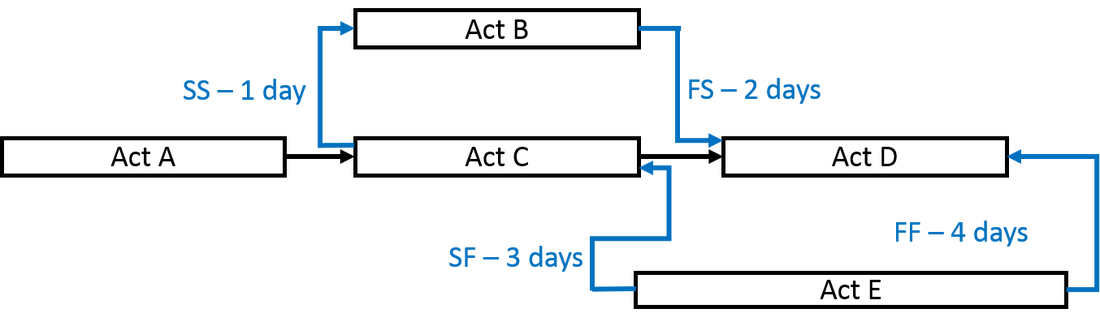 Figure 6: Lead | An example where lead can be used is if you want to start the painting of the building two days before the plastering of all the walls are completed. This can be defined as a FS-2 days relationship. |
The lead relationships indicated in the example as per Figure 6 represent the following:
- The SS-1 day relationship between activities C and B indicates that activity B cannot start until activity C has started minus one day. In other words activity B can start one day before activity C starts.
- The FS-2 days relationship between activities B and D indicate that activity D cannot start until activity B is completed minus two days. In other words activity D can start 2 days before activity B is completed.
- The SF-3 days relationship between activities E and C indicate that activity C can not finish until activity E has started minus 3 days. This means that activity C can finish 3 days before activity E starts.
- The FF-4 days relationship between activities E and D indicate that activity D can not finish until activity E is completed minus 4 days. Therefore activity D can finish 4 days before activity E finishes.
Lag
A lag is the amount of time whereby a successor activity will be delayed (i.e. number of days) with respect to a predecessor activity. For example once the wall is painted with the primer coat (predecessor) the primer coating needs 2 days to dry (lag) before the final coat (successor) can be applied. The lag relationships indicated in the example as per Figure 7 represent the following:
| 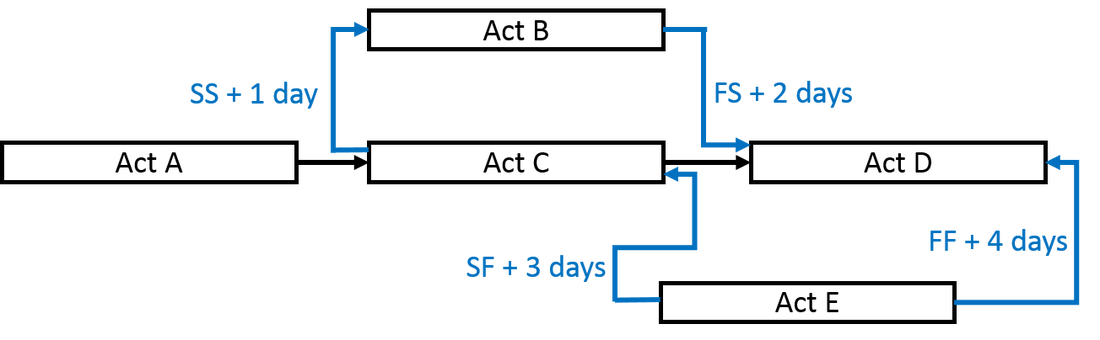 Figure 7: Lag relationships |
- The FS+2 days relationship between activities B and D indicate that activity D cannot start until activity B is completed plus two days. In other words activity D can start 2 days after activity B is completed.
- The SF+3 days relationship between activities E and C indicate that activity C can not finish until activity E has started plus 3 days. This means that activity C can finish 3 days after activity E starts.
- The FF+4 days relationship between activities E and D indicate that activity D can not finish until activity E is completed plus 4 days. Therefore activity D can finish 4 days after activity E finishes.
How do we create the Network Diagram?
The network diagram represents the scheduling logic of the project. This scheduling logic consists of the activities and the logical relationships or dependencies that exists between the activities. We need to determine what the logical relationship between the activities are and then use these relationships to create the network diagram for our project.
Some relationships are fairly obvious to determine for instance you can not paint the wall before the wall is built, assuming we are referring to a bricks and mortar wall. These dependencies that are legally or contractually required or inherent in the nature of the work are referred to as Mandatory dependencies and normally make up the bulk of the dependencies in the network diagram.
Some relationships are not that obvious to determine. If for instance you need to tile the floor and paint the walls of a room - which should be done first? If you first paint the wall and then tile the floor the tiler may get tile glue and grout on the walls. If you first tile the floor and then paint the walls the painter may spill paint on the floor or the tiles may be damaged with the scaffolding. These dependencies are called discretionary dependencies, preferred logic or soft logic. Many of the dependencies prescribed by a project management methodology are discretionary dependencies.
We must also remember that some dependencies involve a relationship between project activities and non-project activities, usually outside the project team’s control. These are referred to as External dependencies. An example of an external dependency can be the obtaining of a environmental impact assessment done by a third party.
Internal dependencies involve a precedence relationship between project activities and are generally inside the project team’s control. For example, if the team cannot test a machine until they assemble it, this is an internal mandatory dependency.
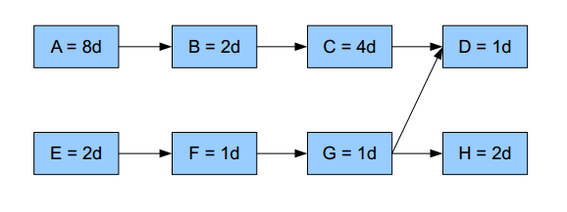
The minimum information required to build the network logic diagram is the activity (number and/or description), the activity duration and the predecessor - see Figure 8.
Some relationships are fairly obvious to determine for instance you can not paint the wall before the wall is built, assuming we are referring to a bricks and mortar wall. These dependencies that are legally or contractually required or inherent in the nature of the work are referred to as Mandatory dependencies and normally make up the bulk of the dependencies in the network diagram.
Some relationships are not that obvious to determine. If for instance you need to tile the floor and paint the walls of a room - which should be done first? If you first paint the wall and then tile the floor the tiler may get tile glue and grout on the walls. If you first tile the floor and then paint the walls the painter may spill paint on the floor or the tiles may be damaged with the scaffolding. These dependencies are called discretionary dependencies, preferred logic or soft logic. Many of the dependencies prescribed by a project management methodology are discretionary dependencies.
We must also remember that some dependencies involve a relationship between project activities and non-project activities, usually outside the project team’s control. These are referred to as External dependencies. An example of an external dependency can be the obtaining of a environmental impact assessment done by a third party.
Internal dependencies involve a precedence relationship between project activities and are generally inside the project team’s control. For example, if the team cannot test a machine until they assemble it, this is an internal mandatory dependency.
The minimum information required to build the network logic diagram is the activity (number and/or description), the activity duration and the predecessor - see Figure 8.
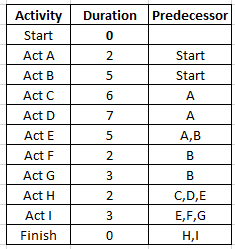 Figure 8: Scheduling data |  Figure 9: Network logic |
From the information displayed in the table with the scheduling data (Figure 8) it is easy to compile the network diagram (Figure 9). We must keep in mind that the durations allocated to the activities at this stage may be fairly high level estimates as the resources may not necessarily been allocated to the activities yet and as such the durations may be subject to adjustment once the resources are assigned to the activities. See my post "From Stakeholder to Budget" for more information in this regard.
Forward pass
Once the network logic is sorted out we can start to calculate the early start and early finish dates for every activity - and this exercise we call a forward pass. But what do we mean by "forward pass", "Early Start Date" and "Early Finish Date"?
Forward pass:- A critical path method technique for calculating the early start and early finish dates by working forward through the network diagram from the project start date or a given point in time.
Early Start date (ES):- the earliest possible point in time when the uncompleted portions of a schedule activity can start based on the schedule network logic. The early start date of the first activity in the network diagram is set as equal to zero. In a FS relationship as is the case with the example in Figure 10, The early start date of the successor(s) activitie(s) are set as equal to the early finish date of the predecessor activity.
Early Finish date (EF):- the earliest possible point in time when the uncompleted portions of a schedule activity can finish based on the schedule network logic. The early finish date of an activity is calculated by adding the activity duration to the early start date. (EF = ES + Duration).
Let's look at a simple example of a forward pass:
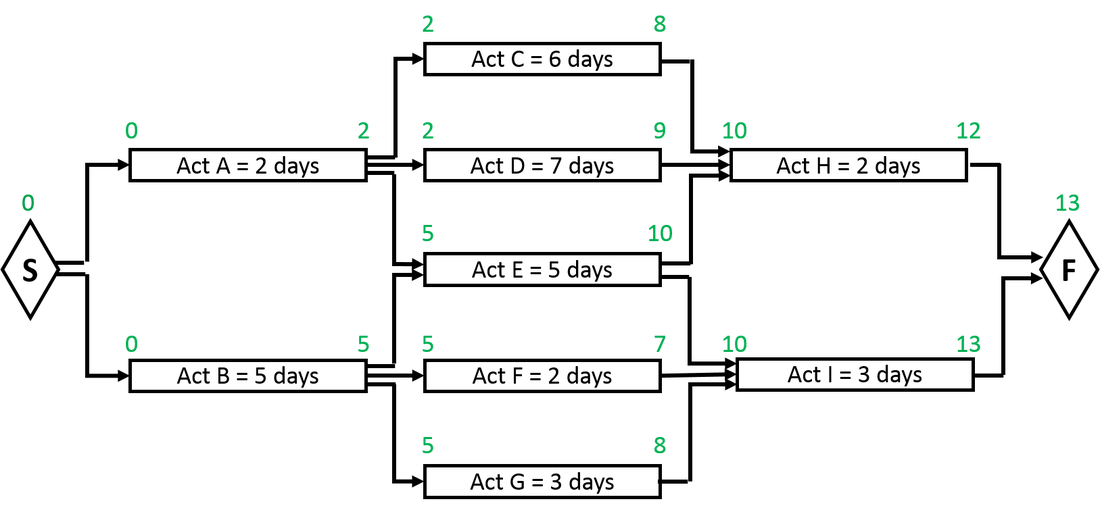
Figure 10: Forward pass
In order to calculate the early start and early finish for every activity we start at the beginning (start activity) and work from left to right until we reach the end activity. There are more than one method that can be used to calculate the early start and early finish dates for each activity - we will here only discuss the most commonly used method that also happens to be the easiest method to use.
- Start:-The start activity kicks of the project. In this example the start activity is a milestone with a duration of zero days. The project starts on day zero and due to the fact that the start activity has a duration of zero, the early start and early finish for the start activity will both be zero.
- Act A:- This activity has a FS relationship to the start activity meaning that as soon as the go-ahead for the project is obtained, this activity can start. If the approval is obtained on day zero then the earliest that act A can start (ES) is on day zero. Using the formula EF = ES + duration we can calculate the EF date for this activity. EF = 0 + 2. The EF is therefore day 2.
- Act B:-This activity also has a FS relationship to the start activity meaning that as soon as the go-ahead for the project is obtained, this activity can also start. If the approval is obtained on day zero then the earliest that act B can start (ES) is on day zero. Using the formula EF = ES + Duration we can calculate the EF date for this activity. EF = 0 + 5. The EF is therefore day 5.
- Act C:-This activity has a FS relationship with act A. Therefore if the earliest act A can finish is on day 2, then the earliest act C can start is on day 2. The EF is calculated as 2+6=8 using the formula (EF=ES+Duration).
- Act D:-This activity has a FS relationship with act A. Therefore if the earliest act A can finish is on day 2, then the earliest act C can start is on day 2. The EF is calculated as 2+7=9 using the formula (EF=ES+Duration).
- Act E:-This activity has a FS relationship with act A as well as with act B. The FS relationship stipulates that act E can not start unless both the predecessors (A and B) have been completed. Act A can be completed at the earliest on day 2 and act B can be completed at the earliest on day 5. Therefore due to the fact that act E can not start before both A and B are completed, the earliest act E can start is on day 5. The EF is calculated as 5+5=10 using the formula (EF=ES+Duration).
- Act F:-This activity has a FS relationship with act B. Therefore if the earliest act B can finish is on day 5, then the earliest act F can start is on day 5. The EF is calculated as 5+2=7 using the formula (EF=ES+Duration).
- Act G:-This activity has a FS relationship with act B. Therefore if the earliest act B can finish is on day 5, then the earliest act G can start is on day 5. The EF is calculated as 5+3=8 using the formula (EF=ES+Duration).
- Act H:-This activity has a FS relationship with activities C, D and E. The FS relationship stipulates that act H can not start unless all the predecessors (C,D and E) have been completed. Act C can be completed at the earliest on day 8, act D on day 9 and act E can be completed at the earliest on day 10. Therefore due to the fact that act H can not start before C,D and E are completed, the earliest act H can start is on day 10. The EF is calculated as 10+2=12 using the formula (EF=ES+Duration).
- Act I:-This activity has a FS relationship with activities E, F and G. The FS relationship stipulates that act I can not start unless all the predecessors E, F and G) have been completed. Act E can be completed at the earliest on day 10, act F on day 7 and act G can be completed at the earliest on day 8. Therefore due to the fact that act I can not start before all three the predecessors (E, F and G) are completed, the earliest act I can start is on day 10. The EF is calculated as 10+3=13 using the formula (EF=ES+Duration).
- Finish:- The finish activity is, just like the start activity, a milestone with zero duration. The finish activity is dependent FS on act H and act I. The earliest H can be completed is on day 12 and for I it is day 13. The finish milestone therefore falls on day 13.
We have now completed the forward pass of this example. What information did it make available to us?
- The earliest day on which every activity can start and finish.
- The shortest time span within which the project can be completed namely 13 days.
The backward pass
Once we have completed the forward pass we can do the backward pass to calculate the latest day on which every activity can start and finish. Let's look at what we mean by:
Backward Pass:- A critical path method technique for calculating the late start and late finish dates by working backward through the schedule model from the project end date.
Late Finish date (LF):- the latest possible point in time when the uncompleted portions of a schedule activity can finish based on the schedule network logic. The late finish of the last activity (Finish activity) is set as equal to the early finish of that activity as calculated by the forward pass. In determining the late finish dates of every other activity we simply ask the question "If the latest the successor can start is day X and the FS relationship stipulates that it can not start until all of the predecessors are completed, then what is the latest date on which the predecessor(s) can be completed?"
Late Start date (LS):- the latest possible point in time when the uncompleted portions of a schedule activity can start based on the schedule network logic. The late start of every activity is calculated by the formula LS = LF - Duration.
Let's look at how we do the backward pass. In order to calculating the late start and late finish dates for every activity we start at the end (finish activity) and work from right to left until we reach the start activity:
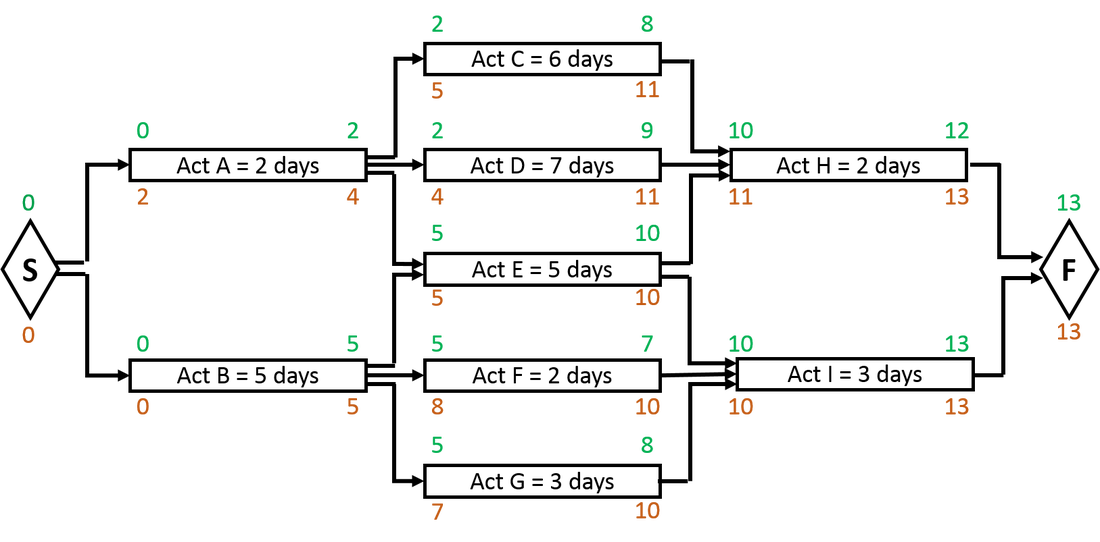
Figure 11: Backward pass
- Finish:- As stated, the LF of the last activity in the network diagram is set as equal to the EF of that activity. In this case (Figure 11) it is day 13. As this finish activity is a milestone with zero duration the LS will be the same as the LF as calculated by the formula LS = LF - Duration.
- Act H:- If the latest date of the finish activity is day 13, then the latest act H can finish will be day 13 as there is a FS relationship between act H and the finish activity that stipulates that the finish activity can not start until act H is completed. The LS = LF - Duration, that is 13 - 2 = 11. The latest act H can therefore start is day 11.
- Act I:- If the latest date of the finish activity is day 13, then the latest act I can finish will be day 13 as there is a FS relationship between act I and the finish activity that stipulates that the finish activity can not start until act I is completed. The LS = LF - Duration, that is 13 - 3 = 10. The latest act I can therefore start is day 10.
- Act C:- If the LS date of act H is day 11, then the latest act C can finish will be day 11. The LS= LF-Duration, that is 11 - 6 = 5.
- Act D:- If the LS date of act H is day 11, then the latest act D can finish will be day 11. The LS= LF-Duration, that is 11 - 7 = 4.
- Act E:- There is a FS relationship between act H and act E as well as between act I and act E. Therefore act E can not finish later than the start dates of either act H or act I. The LS of act H is day 11 and that of act I is day 10. Therefore the latest act E can finish will be day 10. Finishing act E on day 10 will provide for act I to start on day 10 and will not be a problem for act H starting on day 11. The LS= LF-Duration, that is 10 - 5 = 5.
- Act F:- If the LS date of act I is day 10, then the latest act F can finish will be day 10. The LS= LF-Duration, that is 10 - 2 = 8.
- Act G:- If the LS date of act I is day 10, then the latest act G can finish will be day 10. The LS= LF-Duration, that is 10 - 3 = 7.
- Act A:- There is a FS relationship between act A and activities C, D and E. This means that act A can not finish later than the late start dates of any of these three successor activities. The late start dates are C equals day 5, D equals day 4 and E equals day 5. Therefore the latest act A can finish will be day 4. The LS = LF-Duration, that is 4 - 2 = 2.
- Act B:- There is a FS relationship between act B and activities E, F and G. This means that act B can not finish later than the late start dates of any of these three successor activities. The late start dates are E equals day 5, F equals day 8 and G equals day 7. Therefore the latest act B can finish will be day 5. The LS = LF-Duration, that is 5 - 5 = 0.
- Start:- There is a FS relationship between the start milestone and activities A and B. That means that the start activity can not occur later than the latest of the start dates of either act A or B. The LS for A equals day 2 and that for B equals day 0. Therefore the latest date for the start activity is day 0.
Calculating float
Float, Total Float, Slack or Total Slack is defined as the amount of time that a schedule activity can be delayed or extended from its early start date without delaying the project finish date or violating a schedule constraint.
Float is calculated by the formula Float = Late start – Early Start, or Late Finish – Early Finish
Float is calculated by the formula Float = Late start – Early Start, or Late Finish – Early Finish
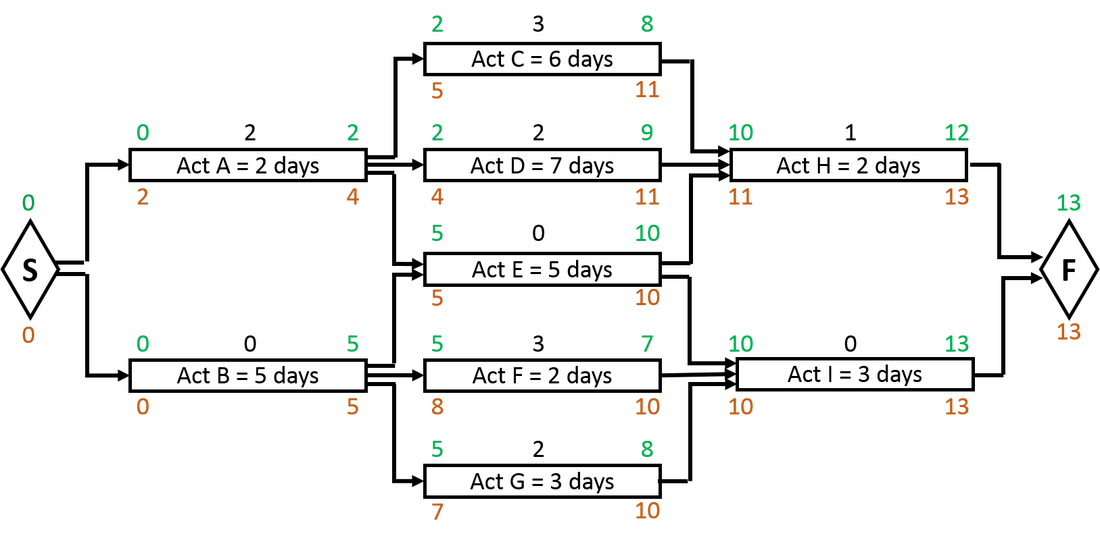
Figure 12: Calculating Float
| The float as indicated on the network diagram can be verified by the data in the following table as per figure 13. According the data we can see that act A can start on day 0 and finish on day 2. It can also start on day 1 and finish on day 3. At the latest it can start on day 2 and finish on day 4. | 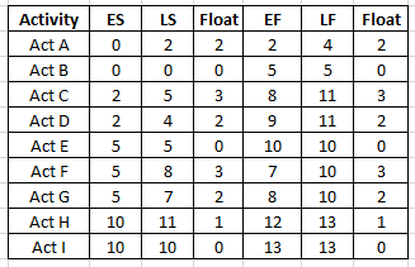 Figure 13: Table of float calculations |
Should it however start on day 3 and finish on day 5 it will have a knock-on effect on the activities further down the line with the effect that the project will only be completed on day 14. We must remember that if we use the float on one activity it can change the float on successor activities.
Determining the Critical Path
The Critical Path is generally the sequence of schedule activities determining the duration of the project and is:
- The longest path through the project.
- The path with the least float.
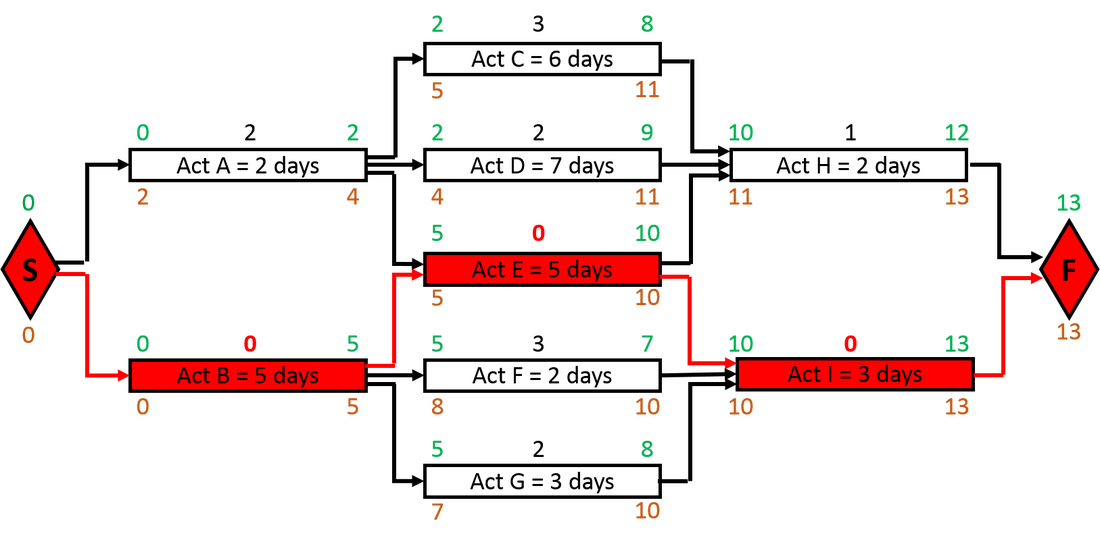
Figure 14: The Critical Path
On this project it would be a good idea to watch carefully over Act B, Act E and Act I. If there is any slippage on any one of these three activities it will delay the project end date.
A project can have multiple critical paths and critical paths can also change due to progress made or not made on the project. If for instance in the above example act A that has initially had 2 days of float, for some reason is only completed on day 6 and not on the latest day 4 as originally planned, the critical path will then be as follows (see figure 15).
A project can have multiple critical paths and critical paths can also change due to progress made or not made on the project. If for instance in the above example act A that has initially had 2 days of float, for some reason is only completed on day 6 and not on the latest day 4 as originally planned, the critical path will then be as follows (see figure 15).
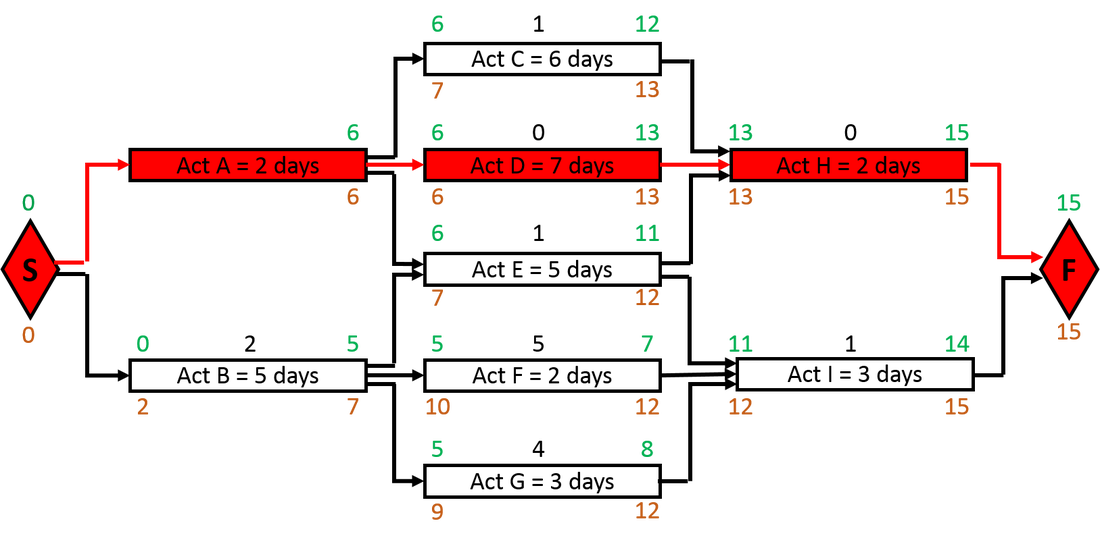
Figure 15: Changed Critical Path
Exercise
How many days float does activity E have?
a) 6 days
b) 10 days
c) 0 days
d) 9 days
a) 6 days
b) 10 days
c) 0 days
d) 9 days
Scheduling Exercise
For the model solution please go to model answer
Enjoyed this article? Leave a comment below; or share it with your friends – Tweet, Like, Follow, Pin it with the share buttons in the side bar
Enjoyed this article? Leave a comment below; or share it with your friends – Tweet, Like, Follow, Pin it with the share buttons in the side bar

 RSS Feed
