How can PERT help us?
All projects depend on estimations. We have to estimate the time it will take to complete an activity and we need to estimate the cost that will be incurred in executing an activity, phase or project. Estimates are approximations or "best guesses" and is subject to the uncertainty with which we are confronted when making these estimates. From this we can see that the more uncertainty there is, the less accurate our guess is, and therefore the higher the risk is that our time and cost estimates will not be realistic. Should we only rely on one estimated figure, for instance "it will take 8 days to complete the activity", then we will not take the uncertainty into consideration. In short, PERT is a technique that helps us to take this uncertainty into account when compiling realistic estimates on our projects.
So what is PERT?
What is PERT (Program Evaluation and Review Technique) and how can we use it to help us on projects? PERT is a three point activity estimating technique that considers estimation uncertainty and risk by using three estimates to define an approximate probability for an activity’s cost or duration. The three estimates used are:
- Most likely (M) - The cost/duration of the activity, based on a realistic effort assessment for the required work and any predicted expenses.
- Optimistic(O) - The activity cost/duration based on an analysis of the best-case scenario for the activity.
- Pessimistic(P) - The activity cost/duration based on an analysis of the worst-case scenario for the activity.
How can PERT help us at activity level?
At activity level PERT can help us to determine a more realistic estimate. Let us take the following estimates for five project activities as an example:
| Let us assume that we obtained the following three estimates for Activity A. Optimistically we can complete the activity in five (5) days. Pessimistically we estimate that it can take us up to Fifteen (15) days, while most likely it will take us only seven (7) days. | 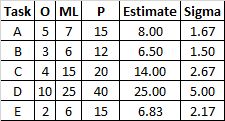 Activity level PERT |
PERT calculates a weighted average as the PERT estimate by using the formula : Pert Estimate = (Optimistic + (4 X Most Likely) + Pessimistic)/6. That means that we are weighting the most likely estimate by a factor of four (4) and then determining the average of the weighted most likely time, the best case scenario and the worst case scenario. In the case of Activity A that will be (5 +(4 X 7) +15)/6. The pert estimate is therefore calculated as 8 days. If we compare the PERT estimate of 8 days with the normal average of the three estimates of 9 days (5 + 7 + 15 /3 = 9) we can see that the PERT estimated is weighted towards the most likely estimate. We use a weighted average calculation because statistically we find that the largest portion of a randomly occurring population of data will be found close to the mean as can be seen from the following bell curve, also called a normal distribution curve:
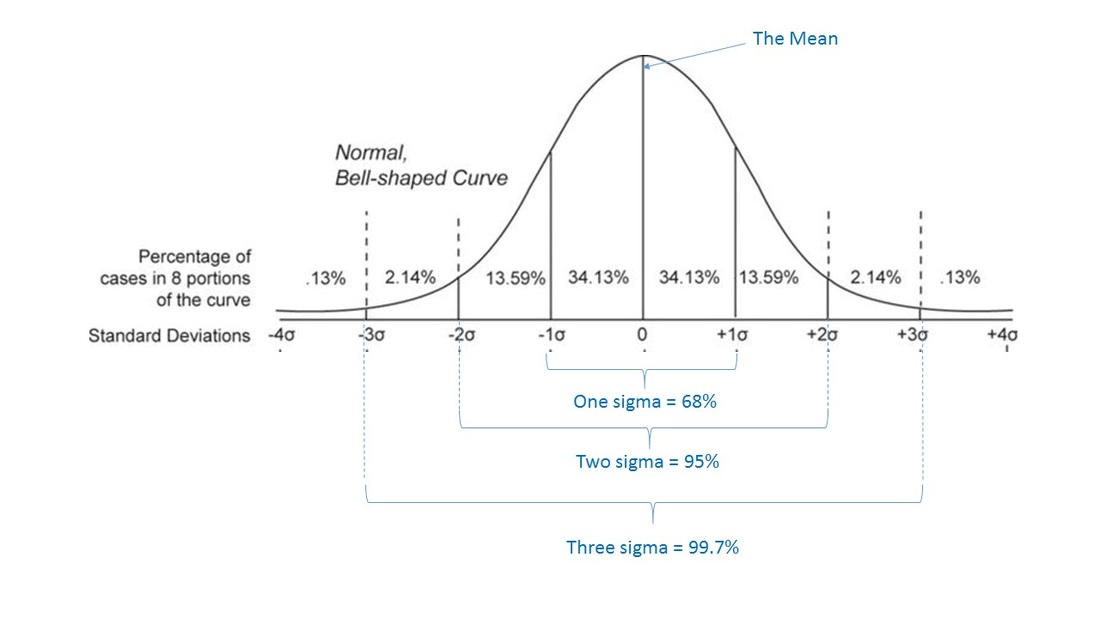
Bell Curve or Normal Distribution Curve
This bell curve shows us that if we divide the data into 6 equal portions, then by far the majority of the instances will be found in the 2 portions next to and on both sides of the middle line (mean) while the probability of the occurrence falling in either the optimistic or pessimistic block is much lower. We divide the graph into 6 equal block by calculating the standard deviation also called the sigma (identified by the sigma symbol “ϭ”). By using the simple formula Sigma = (Pessimistic – Optimistic) / 6 we divide the graph in 6 equal blocks. From this we can see that the PERT estimating formula using (Optimistic + (4 X Most Likely) + Pessimistic)/6 is based on this natural distribution. This also gives us a tool with which we can quantify the probability of how the data will be distributed. Statistically we know that:
Lets apply this to Activity A:
- 68% of the data will be found in one standard deviation from the mean in other words between the mean minus one standard deviation and the mean plus one standard deviation. We can also say that there is a 68% probability that the activity will be completed within one standard deviation from the mean.
- We also see that 95% of the data will be found within two standard deviations or, put another way, that we can say with 95% certainty that the activity will be completed withing the two sigma range.
- At three sigma there is a 99,7% probability.
Lets apply this to Activity A:
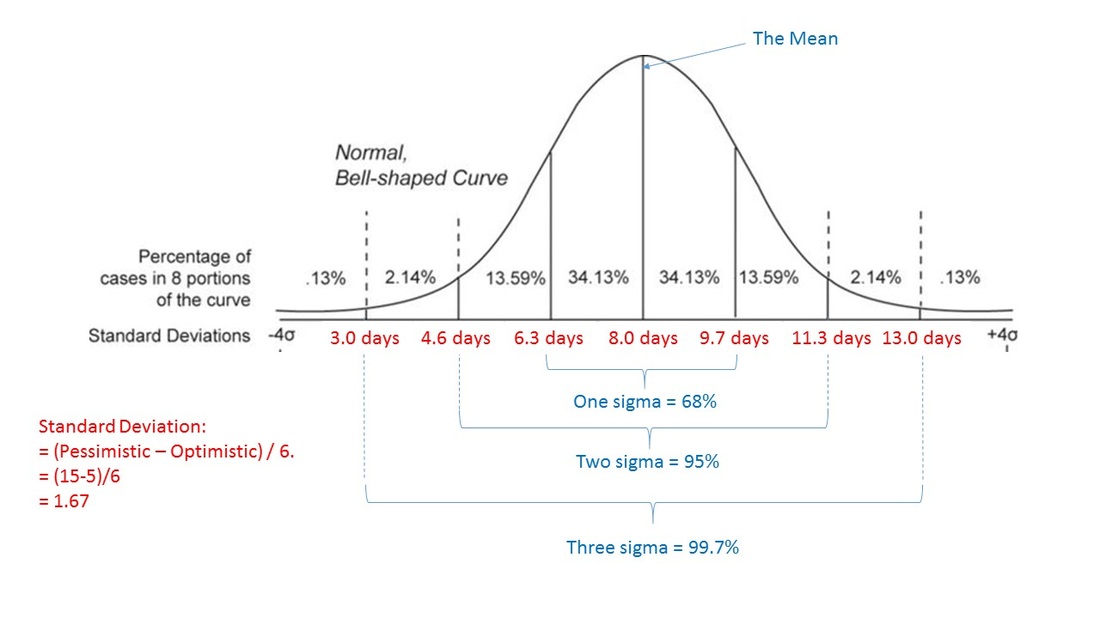
Bell curve for Activity A
From the above bell curve we can thus predict that there is:
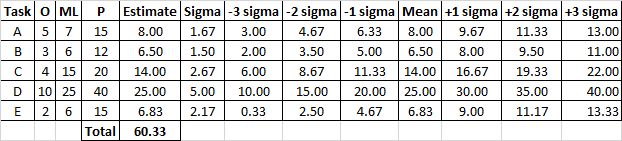
The same formulas can be used to calculate the one, two and three sigma figures for all the activities:
- A 68% probability of completing the activity between 6.3 and 9.7 days.
- A 95% probability of completing the activity between 4.6 and 11.3 days.
- A 99.7% probability of completing the activity between 3.0 and 13.0 days.
The same formulas can be used to calculate the one, two and three sigma figures for all the activities:
Activity estimating uncertainty
How can PERT help us at project level?
If we assume that all five the activities are on the critical path and that they will all be done sequentially, then it is estimated that it will take 60.3 days to complete the project. But we also saw from the PERT calculations on activity level that there is uncertainty regarding the estimates for every activity. Therefore there is a probability that any activity can take longer or shorter than the PERT estimate to be completed. Because we do not know which activities will take shorter and which will take longer the only option is to accept that some will take less time and some will take more time to be completed. This means that it will be unrealistic to ad up all the sigma values and make them applicable to the critical path. However, there is a more realistic way to calculate the uncertainty of how long it will take to complete the entire project. We can calculate a more realistic standard deviation for the critical path by using the formula "Project critical path Sigma = √(sum of all PERT variances)". We need to determine the PERT variances for this formula by calculating sigma square (sigma X sigma). Then we add all the PERT variances together and calculate the square root of the sum. This calculation gives a more realistic standard deviation that can be used to express the uncertainty applicable to the project due date. The following table shows the individual values of the PERT variance for every PERT standard deviation:
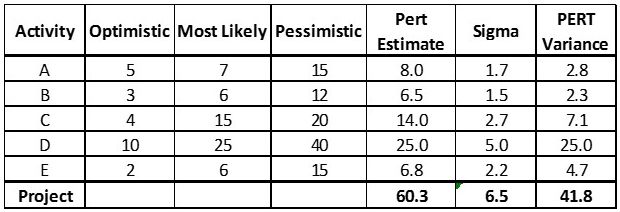
The project standard deviation can be calculated by determining the square root of the sum of the PERT variances. As per the above table the sum of the PERT variances is 41.8. The square root of 41.8 is 6.5. Therefore one standard deviation for the project as a whole is 6.5 days. This value can now be used to calculate the values for one, two and three sigma for the total project:
In practice these percentages can be used to indicate to the sponsor that, due to the uncertainty regarding the estimates, there is a:
Enjoyed this article? Leave a comment below; or share it with your friends – Tweet, Like, Follow, or Pin it with the share buttons in the side bar
- There is a 68% probability that the project will be completed between 53.8 and 66.8 days.
- There is a 95% probability that the project will be completed between 47.3 and 73.3 days.
- There is a 99.7% probability that the project will be completed between 40.8 and 79.8 days.
In practice these percentages can be used to indicate to the sponsor that, due to the uncertainty regarding the estimates, there is a:
- 50% probability that the project will be completed within 60 days.
- 68% probability that the project will be completed within 67 days.
- 95% probability that the project will be completed within 73 days.
- 99.7% probability that the project will be completed within 80 days.
Enjoyed this article? Leave a comment below; or share it with your friends – Tweet, Like, Follow, or Pin it with the share buttons in the side bar
 RSS Feed
